

ABOUT

A Sustainable World brings global challenges to life through interactive maps, real-world data, and multimedia learning resources. The platform shows how issues like climate change, education, health, and gender equality are connected — and how communities in Canada and around the world are responding with creativity and resilience.
Informed by the United Nations’ Sustainable Development Goals and Global Citizenship Education principles, A Sustainable World invites youth and educators across Canada to connect local and global issues and explore pathways for meaningful action.
Come ready to learn, question, and reflect on how you can help shape a more sustainable and inclusive future.

A Sustainable World was developed by Aga Khan Foundation Canada and Canadian Geographic, in partnership with the Government of Canada.
Start Here
The project components are mutually reinforcing and can be browsed independently, or with
guidance from an educator as part of a group lesson. For a first visit to the site, we suggest
starting with the brief tour of the features and functions of the interactive map, then diving into some independent exploration of the map themes and data.
Interactive map
Clicking on a theme will load a completely new data set into the map
- When you click on a theme on the left hand side of the map, a legend will pop up the bottom to explain the data you see.
- The legend will tell you what the colours and symbols mean, and how the data relates to one or more of the Sustainable Development Goals (SDGs).
- Start by exploring the map in either 3D or 2D mode. The legend can help you understand the bigger picture behind each theme. Feel free to jump between themes as your interests change.
- To make the experience easier to follow, only one theme is displayed at a time.
COUNTRY profiles
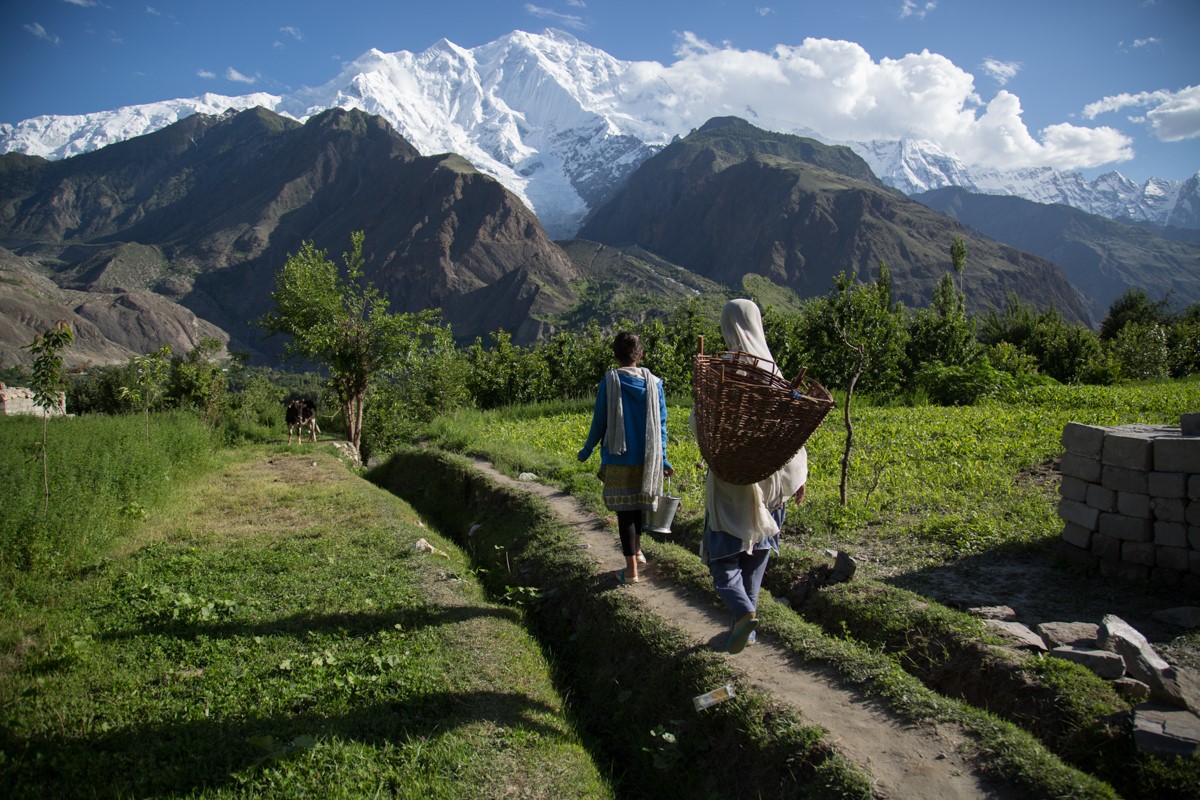
- When you select a country, a panel slides in from the left with a snapshot of key facts, including its land area, population, life expectancy, and GDP per person.
- From there, you can explore additional tabs to learn more about how that country connects to each map theme. These sections include data from the map itself, such as statistics about access to clean water or school attendance, along with other related statistics like participation in early childhood education or renewable energy production.
- Curious how countries compare? Use the dropdown menu at the top of the panel to select a second country and see the differences side by side.
- These country profiles are designed to help you build a deeper understanding of the world, explore how people live in different places, and think about the opportunities and challenges communities face, as well as the ways positive change can happen.
- Note: Boundaries and names come from base maps in Mapbox. The projections used are the standard globe for the 3D view and Winkel Tripel for the 2D view. The boundaries do not imply endorsement of any territorial claim.
Classroom Tools
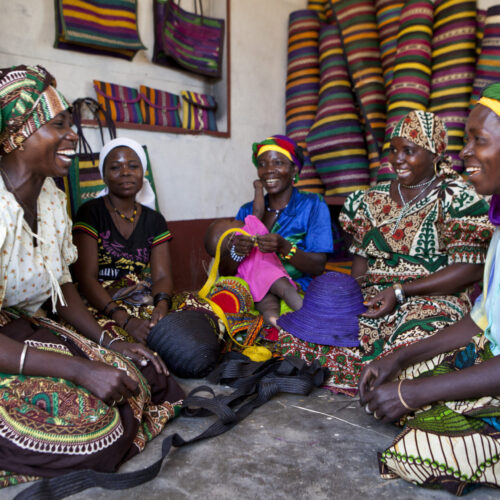
Are you an educator using A Sustainable World in your classroom?
Would you like some guidance on how to introduce and discuss global topics in an age-appropriate way to students aged 12-18? If so, you’re in the right place! Our learning resources were developed in partnership with Canadian Geographic Education. The resources include:
- Guidance on how to use the map
- Ideas on how to dive deeper on the map’s four broad themes (education, gender, climate, and health).
- Activities that encourage students to think, reflect, do, and connect.
- Conversation prompts for those wishing to take their learning further.
Our Approach
Why an Interactive Map?
Interactive maps have become a vital resource in both formal education and public settings. Data visualization helps learners of all ages make sense of complicated data and turn it into useful information. It can allow them to easily identify patterns, analyze trends, and keep track of the ways in which the world around them is rapidly changing. For more information on how we selected and used data, please read below.
About the Data
When selecting data for the map, we were guided by six criteria:
- relevance to the project themes and the United Nations’ Sustainable Development Goals
- relevance to the shared global priorities of Aga Khan Foundation Canada and the Government of Canada
- relevance to/appropriateness for youth in Canada
- degree of completeness
- recency
- update frequency
We use publicly available datasets from trusted international sources such as the World Bank, United Nations agencies, and the World Health Organization. Where data has been compiled, adapted, or processed by another organization, both the original source and processing organization are credited. Because global datasets are updated at different times and may not cover every country equally, we include the latest available year and access date wherever possible.
“Share of population not using an improved water source” and “death rate attributable to unsafe water, sanitation and hygiene”
Education: “Children out of school” and “adult literacy rate”
Climate: Children’s Climate Risk Index
Gender: Women’s participation in the workforce
Additional data sources
(country charts)
COUNTRY PROFILES
Area
Wikipedia contributors, “List of countries and dependencies by area,” Wikipedia, The Free Encyclopedia, https://en.wikipedia.org/w/index.php?title=List_of_countries_and_dependencies_by_area&oldid=1346102702 (accessed March 12, 2026).
Population
World Bank, “Population, total,” World Bank Open Data, https://data.worldbank.org/indicator/SP.POP.TOTL (accessed March 30, 2026)
Youth population
World Bank, “Population ages 0-14 (% of total population),” World Bank Open Data, https://data.worldbank.org/indicator/SP.POP.0014.TO.ZS (accessed April 2, 2026)
Urban population
World Bank, “Urban population (% of total population),” World Bank Open Data, https://data.worldbank.org/indicator/SP.URB.TOTL.IN.ZS (accessed March 12, 2026)
Population growth rate
World Bank, “Population growth (annual %),” World Bank Open Data, https://data.worldbank.org/indicator/SP.POP.GROW (accessed March 12, 2026)
Life expectancy at birth
World Bank, “Life expectancy at birth, total (years),” World Bank Open Data, https://data.worldbank.org/indicator/SP.DYN.LE00.IN (accessed March 12, 2026)
GDP per capita
World Bank, “GDP per capita (current US$),” World Bank Open Data, https://data.worldbank.org/indicator/NY.GDP.PCAP.CD (accessed March 12, 2026)
HEALTH
Medical doctors per 1,000 people
Global Health Workforce Statistics, WHO, via World Bank (2026), processed by Our World in Data, “Medical doctors per 1,000 people, 2023,” Our World in Data, https://ourworldindata.org/grapher/physicians-per-1000-people (accessed April 7, 2026)
Share of population with mental health disorders
IHME, Global Burden of Disease (2025) – with major processing by Our World in Data, “Share of population with mental health disorders – IHME” [dataset]. IHME, Global Burden of Disease, “Global Burden of Disease – Prevalence and Incidence” [original data], https://archive.ourworldindata.org/20260319-181852/grapher/share-with-mental-and-substance-disorders.html (accessed April 7, 2026)
Countries with a stand-alone policy or plan for mental health
World Health Organization – Global Health Observatory (2025) – processed by Our World in Data, “Stand-alone policy or plan for mental health” [dataset]. World Health Organization, “Global Health Observatory” [original data], https://archive.ourworldindata.org/20260304-094028/grapher/stand-alone-policy-or-plan-for-mental-health.html (accessed April 7, 2026)
CLIMATE
Children’s Climate Risk Index
UNICEF, “The Children’s Climate Risk Index Interactive Atlas (beta version, Aug 2021),” https://experience.arcgis.com/experience/0d9d2209bf104584a65e012b03b6d3f8/ (accessed March 12, 2026)
Electricity production from renewable sources
Our World in Data, “Data Page: Share of electricity generated by renewables,” part of the following publication: Hannah Ritchie, Pablo Rosado, and Max Roser (2023) – “Energy.” Data adapted from Ember, Energy Institute, https://archive.ourworldindata.org/20260304-094028/grapher/share-electricity-renewables.html, (archived on March 4, 2026, accessed April 7, 2026)
Access to electricity
Data compiled from multiple sources by World Bank – with minor processing by Our World in Data, “Share of the population with access to electricity – World Bank” [dataset]. SDG 7.1.1 Electrification Dataset, World Bank, via World Bank, “World Development Indicators 125” [original data], https://archive.ourworldindata.org/20260304-094028/grapher/share-of-the-population-with-access-to-electricity.html (archived on March 4, 2026, accessed April 7, 2026)
Days of temperatures above the 90th percentile
Giguere, Joseph/Climate Central, “Climate Change and the Escalation of Global Extreme Heat: Assessing and Addressing the Risks” [dataset], Climate Change and the Escalation of Global Extreme Heat Report, https://www.climatecentral.org/report/climate-change-and-the-escalation-of-global-extreme-heat-2025 (archived May 29, 2025, accessed February 27, 2026)
EDUCATION
Participation in preprimary education
UNESCO Institute for Statistics Education Survey (extracted on October 1, 2025), “Participation rate in organized learning (one year before the official primary entry age), by sex (%),” UIS database, https://www.uis.unesco.org/en/data (accessed February 27, 2026)
Girls completing upper secondary school
Our World in Data, “Data Page: Share of girls that have completed upper secondary school,” part of the following publication: Hannah Ritchie, Veronika Samborska, Esteban Ortiz-Ospina, and Max Roser (2023) – “Global Education”. Data adapted from UNESCO Institute for Statistics, https://archive.ourworldindata.org/20260304-094028/grapher/school-completion.html [online resource] (archived on March 4, 2026, accessed March 12, 2026)
GENDER
Share of women in parliament
V-Dem (2026) – processed by Our World in Data, “Share of women in parliament – V-Dem” [dataset], V-Dem, “Democracy report v16” [original data], https://archive.ourworldindata.org/20260402-164039/grapher/share-of-women-in-parliament.html (archived on April 2, 2026, accessed April 7, 2026)
Acknowledgements
Project leads: Natasha Asbury, Alexandra Pope
Developers: Anne Clifford, Tim Clifford
Designer: Greg Dubeau
Cartographer: Chris Brackley
Editorial lead: Caro Rolando
Education leads: John Estabillo, Sophia Mirzayee
Content Reviewers: Carrie LaPorte, Annie Lee, Christine McGuire, Mei-Ling Patterson, Rosemary Quipp
Aga Khan Foundation Canada and Canadian Geographic gratefully acknowledge the many people who contributed their time and insight to this project, including Sara Black, Michelle Chaput, James Ivison, Jenny MacPhee, Rithika Shenoy, Mitchell Taylor, Aaniqa Karmali, Aarishi Ali, Aly Rajab, Amna Khan, Ava Alibhai, Ella Cusack, Gagan Sahota, Malika Yoh, Michelle Onyebuchi, Mishika Khurana, Muzhda Akbari, Peter Huseynzade, Sameer Somani, Sydney Sinclair, and Ziya Bhayani.